The transaction volume significantly increases when the price fluctuates drastically, reflecting changes in market participation.
Technical Indicators
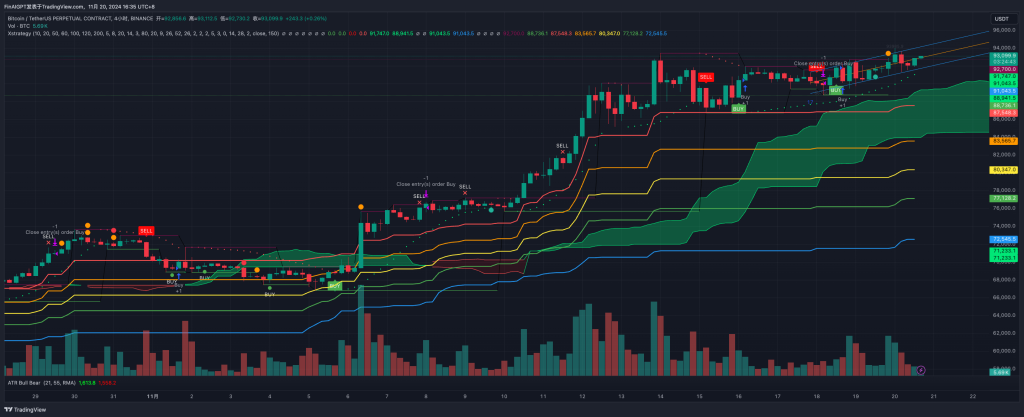
Moving Average (MA)
The short-term moving averages (e.g., 10, 20 periods) are above the long-term moving averages (e.g., 50, 100 periods), indicating a strong upward trend in the short term.
Moving averages of various periods:
10-day MA: 91,747.0 USDT
20-day MA: 91,043.5 USDT
50-day MA: 88,736.1 USDT
100-day MA: 87,548.3 USDT
200-day MA: 83,665.7 USDT
Ichimoku Cloud
Conversion line (Tenkan-sen): 88,941.5 USDT
Base line (Kijun-sen): 88,736.1 USDT
Leading Span A (cloud upper boundary): 91,747.0 USDT
Leading Span B (cloud lower boundary): 91,043.5 USDT
The current price is above the cloud, indicating a bullish market trend.
Buy/Sell Signals
Multiple buy and sell signals marked:
The most recent buy signal appeared before the price rise, indicating accurate signals.
Recent sell signals appeared before the minor price correction.
Average True Range (ATR)
Current ATR value: 1,613.8
A high ATR value indicates high market volatility.
Support and Resistance Levels
Main support levels:
88,736.1 USDT
87,548.3 USDT
83,665.7 USDT
Main resistance levels:
91,747.0 USDT
91,043.5 USDT
Data Trend Analysis
Price Trend
The price has been rising overall recently, with the short-term price moving above the cloud, indicating strong bullish sentiment in the market.
Short-term moving averages are above the long-term moving averages, suggesting a strong upward momentum in the short term.
Transaction Volume Changes
Transaction volume significantly increases when the price fluctuates drastically, indicating an increase in market participation.
High transaction volume is usually accompanied by price fluctuations, so be alert to possible price corrections.
Technical Indicator Trends
Both short-term and long-term moving averages are upward, indicating the overall market is bullish.
The short-term average is above the long-term average, suggesting strong upward momentum in the near term.
Ichimoku Cloud Signals
The price is running above the cloud, showing strong future support.
Both the conversion line and the base line are upward, indicating that the bullish market trend has not changed.
Buy/Sell Signals
Multiple buy and sell signals provide a reference for market sentiment, with the most recent buy signal being accurate.
The buy signals in the short term show that the bullish sentiment in the market is strong.
Volatility (ATR)
The ATR value is 1,613.8, indicating high market volatility.
High volatility means that the price may fluctuate drastically, so it should be treated with caution.
Support and Resistance
Support and resistance levels provide important price reference points, which are helpful for judging possible price corrections and breakthroughs.
Conclusion
Overall Trend: The market is in a bullish trend, and the price has the potential to rise further.
Risk Control: Due to high market volatility, investors need to set reasonable stop-loss and profit targets.
Support and Resistance: Pay close attention to important support and resistance levels, and judge possible price corrections and breakthrough positions.